Golden Cross (50/200 SMA) on BTC-USD (1d): 5-year backtest results
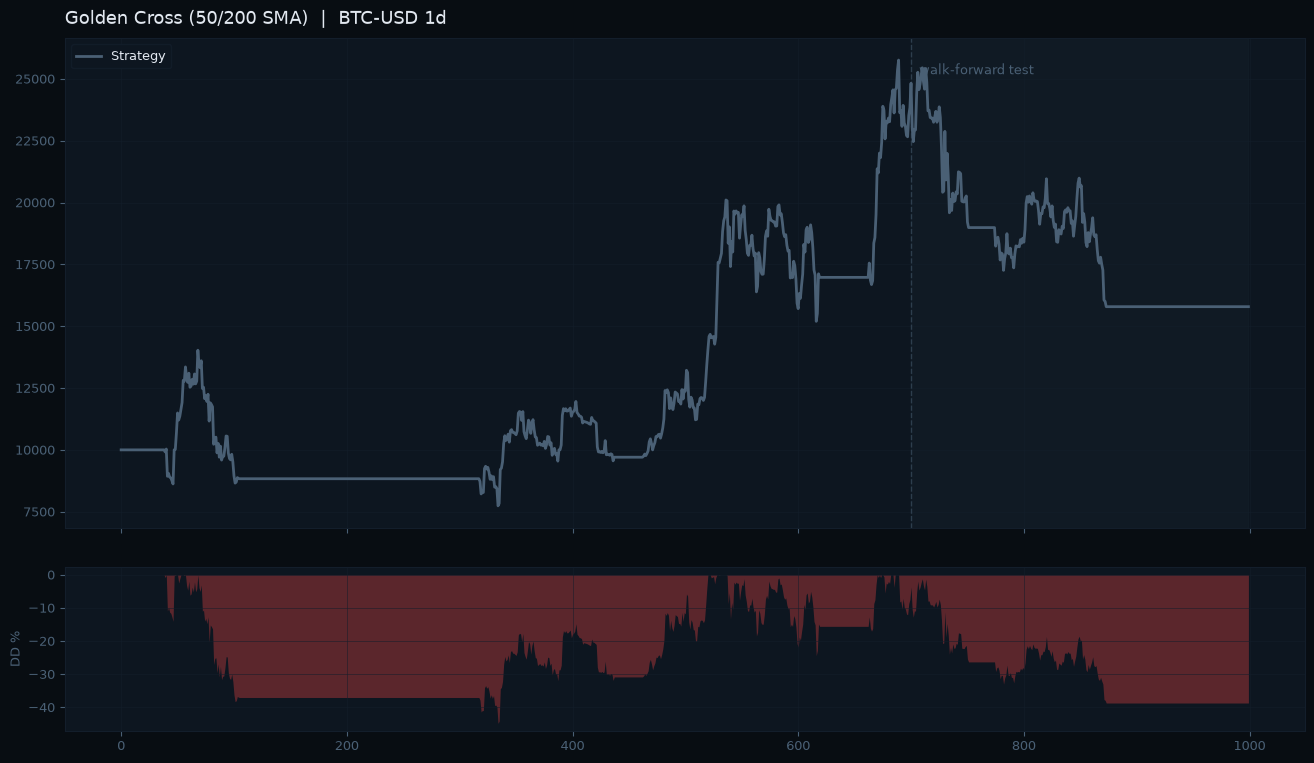
Golden Cross (50/200 SMA) is a trend strategy that goes long BTC when the 50-day SMA crosses above the 200-day SMA and exits on the reverse cross. Tested on 5 years of BTC-USD daily data with Coinbase Advanced spot fees and walk-forward validation, it returned an INSUFFICIENT_SAMPLE verdict: 5 total trades, a 57.9% net return, and a Sharpe of 0.43.
The rules we tested
| Capital | Risk / trade | Fees | Data range | Timeframe |
|---|---|---|---|---|
| $10000 | 1.0% | Coinbase Advanced (spot, 0.6% taker) | 2021-07-07 → 2026-07-06 | 1d |
Verdict scorecard
| Check | Value | Result | Note |
|---|---|---|---|
| total_trades | 5 | INSUFFICIENT_SAMPLE | Fewer than 30 trades. Not enough data to judge either way. |
Thresholds are fixed and public: see the library methodology.
What happened
Over the period from July 2021 to July 2026, the strategy generated 5 trades against a $10,000 starting capital with 0.6% taker fees applied. The headline net return of 57.9% and a 60.0% win rate look superficially acceptable, but those figures rest on an extremely thin trade count. In-sample performance was notably stronger: 4 trades, a 138.68% return, a profit factor of 8.70, and a win rate of 75.0%. The single out-of-sample trade produced a -33.85% return, a profit factor of 0.0, and a win rate of 0.0%. The maximum drawdown reached 45.2% across the full test period. With only 5 trades total, no individual statistic carries statistical weight. The in-sample numbers are dominated by a small cluster of favorable conditions; one losing trade in the out-of-sample window erased the appearance of edge entirely.
Where it broke, or held
Walk-forward degradation was severe. The Sharpe ratio dropped from 0.83 in-sample to -0.79 out-of-sample, a delta of 1.62. Return delta across the split was 172.53 percentage points. The overfit likelihood is classified as severe, and the platform flags a test sample warning on the out-of-sample window due to its single-trade composition. The deepest drawdown of -45.21% ran from November 8, 2021 through March 10, 2023, overlapping four distinct stress events: the post-ATH peak rejection, the Terra/Luna collapse, the FTX collapse, and the Silicon Valley Bank crisis week. The strategy held no stop loss during these episodes, meaning the full drawdown was absorbed passively. Reliability is rated low confidence with a score of 54 out of 100.
The honest read
Five trades over five years is not a sample. It is an anecdote. The INSUFFICIENT_SAMPLE verdict exists precisely for this situation: the data cannot confirm or deny whether the Golden Cross carries a tradeable edge on BTC at the daily timeframe. The severe walk-forward degradation adds a further warning, but even that finding is undermined by the fact that the out-of-sample window contained exactly one trade. What a trader should take from this test is methodological: a signal that fires this rarely requires a much longer data history, a lower timeframe, or a different asset universe before any conclusion about its viability is possible. The 57.9% net return is not evidence of edge; it is noise dressed in a number.
FAQ
Why is the verdict INSUFFICIENT_SAMPLE if the return was 57.9%?
The strategy produced only 5 trades over 5 years. Fewer than 30 trades is the platform threshold for statistical reliability. A 57.9% return across 5 events cannot be distinguished from random variation, regardless of its direction.
What does the out-of-sample result actually show?
The single out-of-sample trade lost 33.85%, producing a profit factor of 0.0 and a Sharpe of -0.79. One trade is not a meaningful out-of-sample result; it confirms only that the split produced too little data to evaluate.
How large was the maximum drawdown and what caused it?
The maximum drawdown was 45.2%, running from November 2021 to March 2023. It overlapped the post-ATH rejection, the Terra/Luna collapse, the FTX collapse, and the Silicon Valley Bank crisis. No stop loss was active during this period.
Could this strategy work with more data or a different timeframe?
This test cannot answer that. A longer historical window or a shorter timeframe that generates more signal crossings would be required before any conclusion about the strategy's viability is statistically supportable.
Change the rules, the risk, the timeframe. Same engine, same honesty.
Run it yourself, free
All results are hypothetical backtests on historical data, generated for educational purposes only. They include fees and slippage assumptions documented above but do not represent live trading. Past performance does not indicate future results. Nothing on this page is financial advice. Trading involves substantial risk of loss.
Run 9df3dc58-7cab-4aa7-b69a-999fccd92904 · engine 05b43ba · last updated 2026-07-09